Ghost Market: When the Trade Looks Perfect but Nobody's There to Take the Other Side
There's a particular flavor of trading hell that doesn't get talked about enough. It's not the bad setup. It's not the impulsive entry. It's the moment when everything you planned works — right up until the part where you need to actually get out.
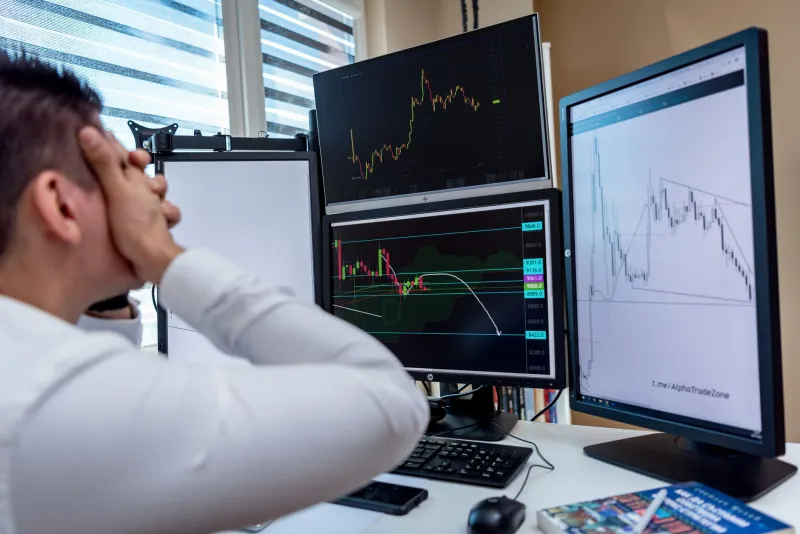
The setup was textbook. Your indicators aligned. Your risk-to-reward looked solid. You hit the button. And then the market decided to have a meltdown, and suddenly the price you needed to exit at was a fantasy. Your stop-loss order sat there like a Help Wanted sign at a ghost town diner — technically valid, practically useless.
Welcome to the liquidity trap. It doesn't care how good your analysis was.
What Liquidity Actually Means (And Why Traders Ignore It)
Most retail traders treat liquidity like oxygen — they assume it's always there until the moment they're gasping for it. In simple terms, liquidity is the market's ability to absorb your order at or near the price you expect. Deep liquidity means thousands of buyers and sellers constantly trading, keeping spreads tight and fills clean. Thin liquidity means you're shouting into a near-empty room, and whoever is there gets to name their price.
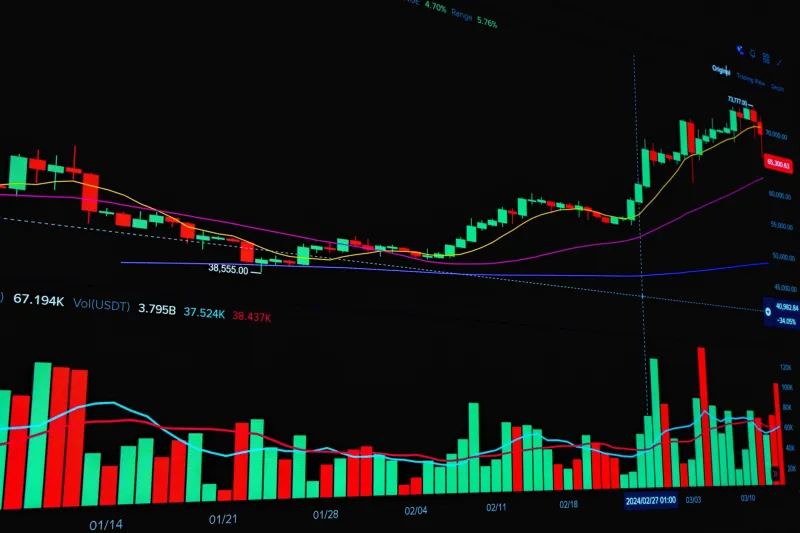
The trap is that liquidity looks perfectly fine the vast majority of the time. You run your backtests on historical data — data that was recorded after the chaos settled. That data shows clean candlestick closes, tidy spreads, orderly price action. What it doesn't show you is the 40-second window during a flash crash when the bid-ask spread on your favorite mid-cap stock blew out from 10 cents to $3.50, or when your forex pair went bid-only for nearly a minute during a central bank surprise.
The historical record is the sanitized version. You've been practicing on the highlight reel.
The Three Ways Illiquidity Destroys a Perfect Trade
Slippage that turns a planned loss into a catastrophic one. Say you're long a small-cap biotech name and news drops — bad news. Your stop was set at $18.40. By the time your market order executes, you're filled at $16.10. That's not slippage. That's a different trade entirely. In liquid markets, slippage is measured in pennies. In panicked markets, it's measured in regret.
Bid-ask spreads that make the math impossible. During normal sessions, you might be trading an ETF with a one-cent spread. During a volatility spike — think March 2020, August 2015, or any surprise Fed announcement — that same instrument can widen to 50 cents or more. If your entire expected profit on the trade was 30 cents, the spread alone just ate your lunch and charged you for the table.
Order book evaporation. This one is the most psychologically brutal. You watch your position move against you, you go to exit, and the visible depth of market just... disappears. The bids that were stacked up are gone. Market makers pulled their quotes. Algorithms stepped back. You're left holding something nobody wants to buy at any price you'd accept. This happens in individual stocks, in thinly traded options, and in less popular futures contracts more often than most traders want to admit.
Why Your Backtest Never Warned You
Here's the uncomfortable truth about backtesting: it's almost always done on close prices or OHLC data, neither of which captures what actually happened intraday during stress events. The data shows a candle closed at $42. It doesn't show that the trade you would have needed to exit during that candle required crossing a $2 spread at 11:47 AM on a Tuesday when three algo desks simultaneously pulled liquidity.
Backtests are maps. Liquidity events are the terrain. And the terrain doesn't care about your map.
This isn't an argument against backtesting — it's an argument for understanding what backtests can and cannot tell you. A strategy that looks profitable on paper might be completely unworkable in real conditions if it depends on clean exits during high-volatility windows.
How to Spot an Illiquid Instrument Before You're Stuck In It
You don't have to learn this lesson the hard way. There are actual, practical ways to screen for liquidity risk before you commit capital.
Check average daily volume — and then check it again on volatile days. A stock averaging 800,000 shares a day sounds reasonable until you realize that on the last three big down days in the market, it traded 200,000 shares. Thin volume on stress days is a red flag that should make you size down or stay out entirely.
Watch the bid-ask spread over time, not just right now. Many brokers and charting platforms let you see historical spread data or at least intraday tick data. If you see spreads that regularly double or triple during the first and last 30 minutes of the session, that's a liquidity-sensitive instrument. Trade it accordingly — or don't trade it at all.
Look at options open interest and market depth. For options traders especially, open interest tells you how many contracts actually exist. A strike with 12 contracts of open interest is not a market. It's a conversation between two people who might not be speaking anymore.
Respect the time-of-day factor. Liquidity in US equities is genuinely different at 9:35 AM versus 2:15 PM versus 3:58 PM. Pre-market and after-hours are their own liquidity deserts. If your strategy involves exits during these windows, you need to stress-test specifically for those conditions.
The Mental Game of Trading Through a Liquidity Event
Here's where Trading Naked gets real with you: even traders who know all of the above freeze up when it actually happens. There's something uniquely paralyzing about watching a position move hard against you while simultaneously watching the order book thin out. The instinct is to wait — to hope the liquidity comes back, to hope the spread tightens, to hope the market stabilizes.
That hope is expensive.
Traders who survive liquidity events have usually pre-decided what they'll do. They've set hard rules: if the spread exceeds X, they take the fill and move on. If volume drops below Y during the trade, they reduce position size regardless of where price is. The decision gets made in calm, not in chaos.
This is why liquidity risk isn't just a market mechanics problem — it's a trading psychology problem. The market doesn't need to beat you. It just needs to confuse you long enough that you beat yourself.
Strip Away the Illusion
The cleanest trades on your screen are only as good as the market's willingness to let you in and out at the prices you need. That willingness is not guaranteed. It's not even consistent. It shows up reliably when nothing is happening and disappears precisely when you need it most.
Trade smaller in thinner instruments. Know your average spread history. Have a plan for when the plan stops working. And the next time a setup looks perfect, ask yourself one more question before you hit the button: Is anyone actually going to be there when I need to leave?
Because sometimes the most dangerous trade isn't the one that goes against you. It's the one that goes against you and locks the exit door on the way out.