Chart Clutter: How Too Many Indicators Are Quietly Killing Your Trades
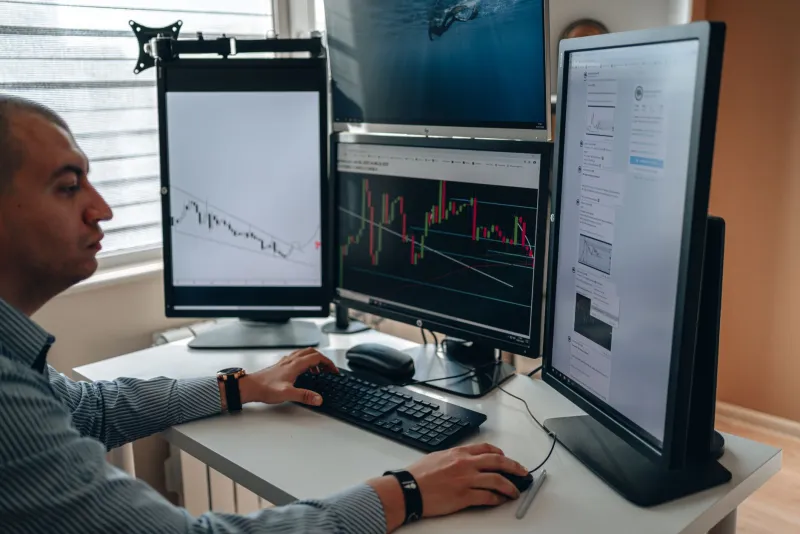
Open up any beginner trader's charting platform and you'll usually find the same thing: a price chart buried under a avalanche of colored lines, oscillators stacked three panels deep, and enough moving averages to wallpaper a Manhattan apartment. It looks impressive. It feels like doing the work. And it is, almost certainly, making every single trading decision harder than it needs to be.
This is indicator addiction — and it's one of the most common and least talked-about psychological traps in retail trading.
The Comfort Trap
Here's the honest truth about why traders load up their charts: it feels safe. Every additional indicator is a psychological security blanket. If you've got RSI, MACD, Bollinger Bands, a 50-day moving average, a 200-day moving average, Fibonacci retracements, and volume bars all firing at once, you feel like you've done your homework. You feel prepared.
But preparation and clarity are not the same thing. In fact, they can be direct opposites.
When you add a fifth or sixth indicator to a chart, you're not adding five or six times the insight. You're adding five or six times the potential for contradiction. And when indicators contradict each other — which they will, constantly — the human brain doesn't respond rationally. It cherry-picks. It gravitates toward whichever signal confirms the trade it already wanted to make.
That's not analysis. That's theater with extra steps.
Why More Data Creates Worse Decisions
There's solid behavioral finance research behind this. A concept called information overload has been studied across fields from medicine to military strategy, and the conclusion is consistent: past a certain threshold, more data degrades decision quality rather than improving it.
For traders, that threshold is lower than most people think. When you're trying to execute in real time — managing emotions, watching price move, calculating risk — your working memory is already under serious strain. Throwing six conflicting signals at your brain in that moment doesn't sharpen your judgment. It paralyzes it.
This is what traders call analysis paralysis. You've seen every possible version of the setup, you've got indicators pointing in three directions, and by the time you've sorted through it all, the move is over. Or worse — you second-guess yourself into a bad entry because one obscure oscillator flashed a warning you'd never have noticed on a cleaner chart.
What the Noise Is Actually Covering Up
Here's something worth sitting with: most indicators are derived from price. RSI is calculated from price. MACD is calculated from price. Stochastics, Bollinger Bands, ATR — all price derivatives. When you stack five of them on top of each other, you're not looking at five independent data sources. You're looking at the same data processed five different ways, with slight time lags between them.
Professional traders — the ones doing this for a living, not selling courses about it — tend to strip things way back. Not because they're lazy, but because they understand that price itself is the most honest signal on the chart. Everything else is interpretation.
The traders who consistently outperform aren't the ones with the most sophisticated setups. They're the ones who've developed a genuine feel for price structure: support and resistance levels, the character of a trend, volume at key zones, and clean candlestick behavior at decision points.
That's it. That's often the whole toolkit.
The Stripped-Down Framework That Actually Works
So what should you actually keep on your chart? Here's a framework worth testing:
One trend tool. A single moving average — the 20-period EMA is popular for good reason — to help you stay oriented to the prevailing direction. Not three moving averages. One. Its job is context, not signals.
One momentum confirmation. If you're going to use an oscillator, pick one and learn it deeply. RSI is fine. MACD is fine. But use it to confirm what price is already suggesting, not to override it. If price looks strong and your oscillator is flashing overbought, trust price structure first.
Raw price action and volume. Learn to read candlestick formations at key levels. Understand what a volume spike means at resistance versus in the middle of a range. This is the foundation that everything else should rest on — not the other way around.
Defined levels before the session opens. Mark your support and resistance zones when the market is closed, with a clear head, before emotions are involved. These levels should drive your decision-making, not real-time indicator readings.
That's four inputs. Most traders are working with twelve. The difference in mental clarity is significant.
Breaking the Addiction
Changing your chart setup sounds simple. Behaviorally, it's actually pretty difficult. Stripping indicators off a chart triggers a genuine anxiety response in traders who've become dependent on them. It feels like flying blind, even when you're actually seeing more clearly.
The way through that discomfort is gradual exposure. Start by removing one indicator per week. Notice whether your trading gets better or worse. Keep a log — not just of P&L, but of your decision quality. Were your entries cleaner? Did you hesitate less? Did you understand why you were in a trade rather than just following a signal?
That self-awareness is the whole point. Trading naked — in the most literal sense — means stripping away everything that obscures your ability to read what the market is actually doing. Indicators were designed to help you see price more clearly. When they start doing the opposite, they've become a liability.
The Bottom Line
The market doesn't reward complexity. It rewards clarity, consistency, and the ability to act decisively when a genuine opportunity presents itself. Every indicator you add to your chart is another filter standing between you and that clarity.
The traders who figure this out early give themselves a serious edge — not because they've found a secret formula, but because they've stopped looking for one. They've accepted that the chart, stripped down to its core, tells you most of what you need to know. The rest is just noise you've learned to mistake for signal.
Clean your charts. Trust price. Do the uncomfortable work of trading with less — and see what you actually learn about yourself in the process.